 English
 Magyar
 Deutsch



If a page loads slowly, the hardest question is usually what exactly is slowing it down: a plugin, a poorly written database query, an external service the page is waiting for, or simply that the hosting account has run out of resources. On cPanel hosting and WordPress hosting, the CloudLinux X-Ray App answers this question.
X-Ray is a PHP profiler: it records, for requests received at the specified address, how long PHP took to process them, and how much of that time was spent on individual WordPress plugins, database queries and PHP functions. You do not need to install a plugin or modify the code, and it is not limited to WordPress: you can monitor any PHP-based website (Joomla, Drupal, PrestaShop, Laravel, or custom-built sites). The breakdown by plugin is only available for WordPress.
Where can you find it?
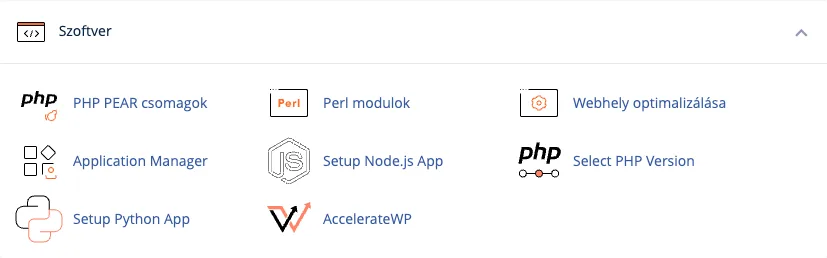
Log in to cPanel and, in the Software group, click on the X-Ray App icon.
The PHP X-Ray page that opens lists your previous tracing tasks. Until you have started one, the list is empty.
Starting a trace
- Click the Start tracing button in the top right-hand corner.
- In the URL row, select the domain from the Choose domain list. The list shows the domains and subdomains of your cPanel account.
- Next to it, in the Specify mask field, enter which addresses within the domain the system should trace:
*the entire website, all pages;/homepage only;products/*all pages under/products/;*cart*any address containing the word “cart” (including the parameters after the?).
The interface adds the slash after the domain itself.
?stands for exactly one character,[ ]for one of the characters listed in the brackets (for examplepage[1-3].php). The How to use special characters? link explains the options with examples. The same mask applies to bothhttp://andhttps://addresses. - By default, X-Ray records the first 20 requests to the specified addresses (Record for: Request, 20). If that suits you, click Run.
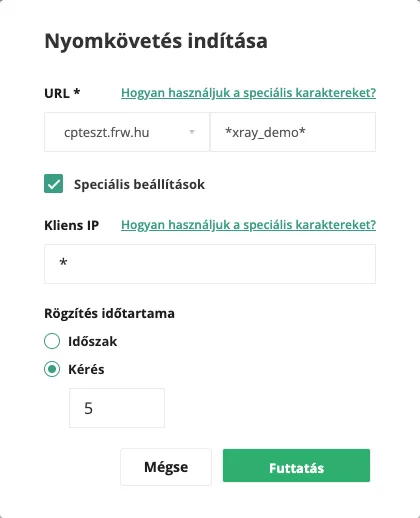
Advanced settings
Ticking the Advanced settings checkbox gives you two more options:
- Client IP: the system only logs requests originating from this IPv4 address. The default value is
*, i.e. requests from all visitors. On a live, high-traffic website, it is advisable to enter your own IP address: this ensures that only requests you initiate from your browser are included in the list, and the system does not log visitors’ addresses or the URLs they access. You can find out your own public IP address, for example, by searching for ‘what is my IP address’. If the website is behind Cloudflare or another proxy, the server may see a different address; if no requests are coming from the IP address you’ve entered, leave the field set to*. - Record for: with Request you set how many requests the system collects, with Time period for how long (Days, Hours, Minutes). The period must be at least 1 minute and at most 2 days.
Only one trace can run at a time. If a task is still running and you start a new one, the interface shows the error message “Limit of running tasks is 1. You already have 1 running task”: wait until the running task has finished, or stop it.
Opening the website while tracing
Tracing records only real requests, so after starting the task, open the pages you are investigating in your browser (or wait for visitors to open them). If the cart or checkout is slow, carry out the slow action; if the admin area is slow, click through the slow admin pages.
Important: X-Ray only sees what PHP runs. If a page is served from a cache (a WordPress caching plugin such as WP Super Cache or W3 Total Cache, or the Cloudflare cache), PHP does not even start, and the request does not appear. In this case, disable the cache temporarily, or log in to the WordPress admin (most caches do not serve stored pages to logged-in users). Images, CSS and JavaScript files are served directly by the web server, so they do not appear in the trace either.
The list of tracing tasks
In the list of tasks, you will see the following:
- URL: the domain and the mask the task applies to.
- Tracing status: Running (below it, how many requests are left, for example “5 times left”), Completed (the requested number of requests has been collected, or the period has ended) or Stopped.
- Client IP: the specified IP address or
*. - Collected requests: the number of requests recorded to date.
- Expires in: how much longer the data of the task is available. The server keeps tasks for 30 days from their creation, then deletes them.
- Actions: the eye icon opens the recorded requests, the square icon stops the running task (confirmation: Yes, stop), the triangle icon resumes a stopped task, and the bin icon deletes the task with all its data (confirmation: Yes, delete).
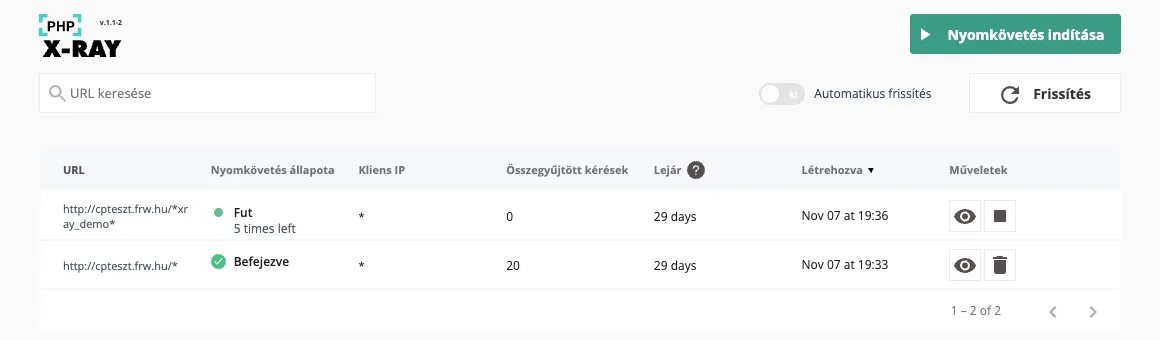
The list does not refresh by itself: click the Refresh button, or switch on the Auto refresh toggle.
The recorded requests
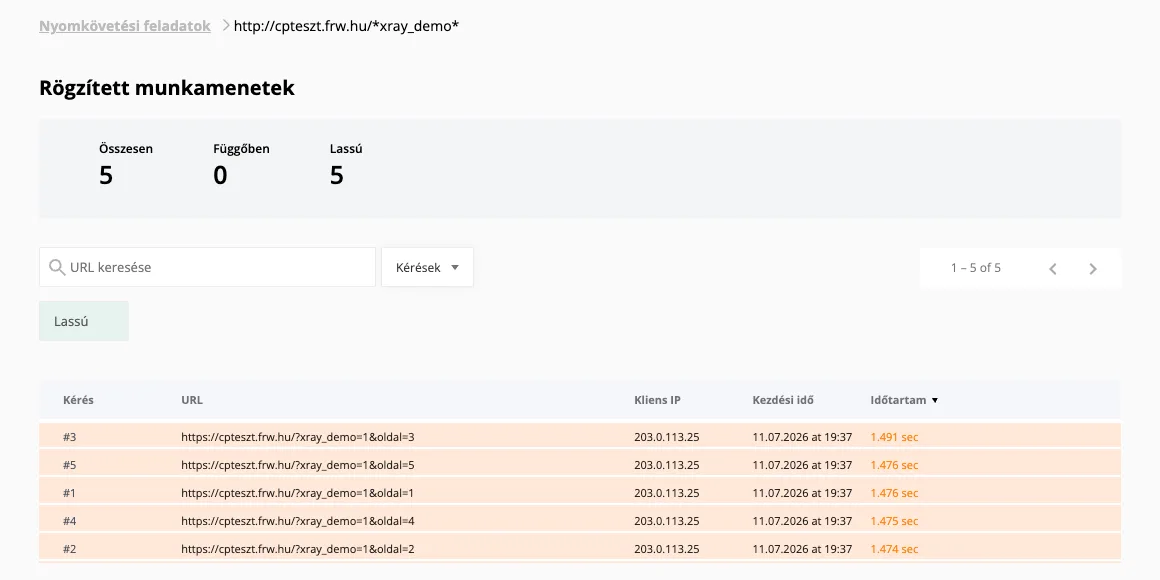
The eye icon opens the Recorded sessions page of the task. At the top, you see three numbers:
- Total: the total number of recorded requests.
- Pending: requests that have already been logged but are currently being processed. These will appear in the table in a few seconds or minutes.
- Slow: requests taking longer than 1 second.
By default, the table shows only the slow requests (as the Slow filter under the search box indicates), slowest first. If there were no slow requests, the message “There are no slow requests detected!” appears; the Show all requests button still shows the fast ones. Use the Requests list to change the filter, and the Search for URL field to search for an address.
Details of a request
Clicking on a row opens a detailed analysis of the request. Use the arrows in the top right-hand corner to move to the next or previous request, and use the Download as PDF button to generate a report, which you can send to your developer or our support team.
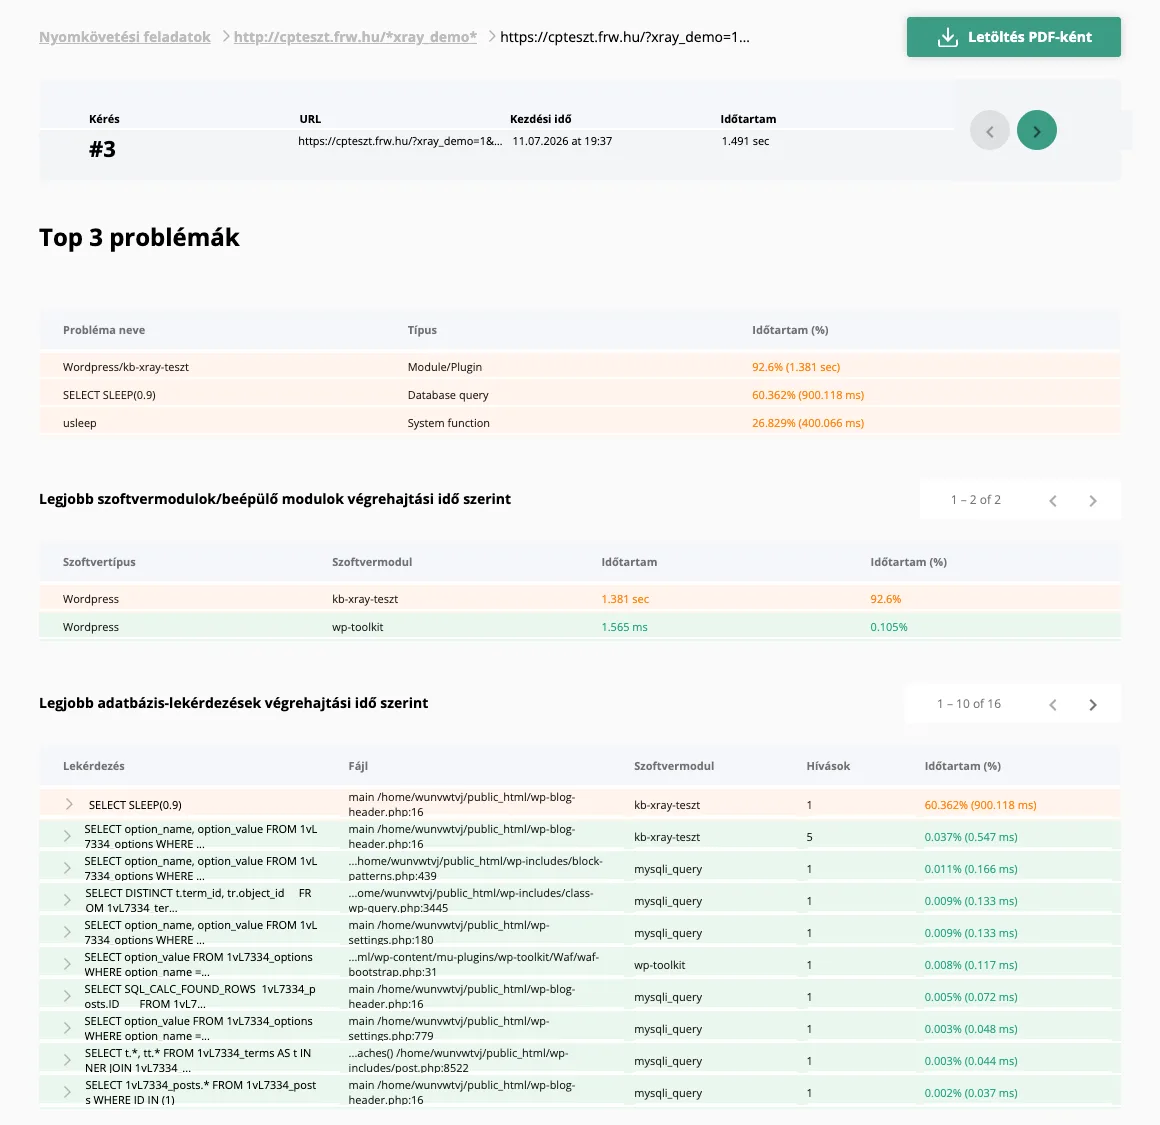
- Top 3 issues: the three slowest parts of the request, with their type (Module/Plugin: a plugin, Database query: a database query, System function: a PHP function). If you look at only one table, look at this one.
- Top software modules/plugins by execution time: the run time of the WordPress plugins. On sites managed with WP Toolkit,
wp-toolkitappears too: this is WP Toolkit’s own module, installed alongside WordPress, and its run time is usually negligible. - Top database queries by execution time: the SQL queries, with the file and line they were started from (File), the plugin they belong to (Software module), and how many times the same query ran (Calls).
- Other system functions: the slowest PHP functions, again listed by file and line.
curl_execis an external HTTP request (for example, calling an API, a licence server or an update checker): in this case, the page was waiting for a response from another server.
Clicking on the arrow at the start of a line displays the full path of the abbreviated file path.
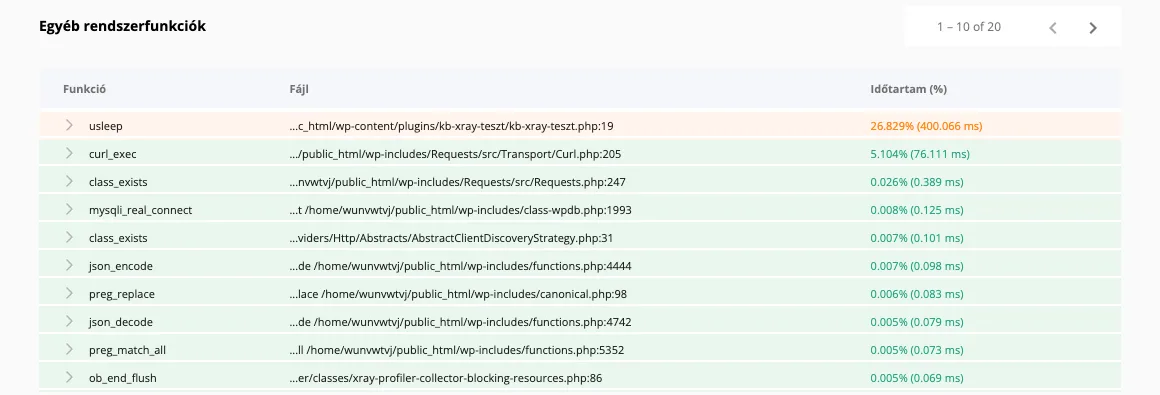
The Duration (%) column shows what percentage of the total request time the item took; the exact time is in brackets. The percentages overlap, so they do not add up to 100%: the time of a plugin includes the time of the queries and functions it starts. In the example above, a test plugin written to be slow on purpose (kb-xray-teszt) took 92.6% of the request, of which a slow query took 60% and a usleep call 27%.
What should you do with the result?
- One plugin takes most of the time: update it to the latest version, check its settings (many plugins collect statistics, call external services or write logs on every page load), and if you do not need it, deactivate it. The article on managing plugins in WP Toolkit explains how. Before changing anything on a live site, try it on a staging copy.
- A database query is slow: the cause is often a bloated table. In WordPress, check the autoloaded data of the wp_options table and the wp_postmeta table.
- The same query runs many times (high Calls value): this is typically a fault in a plugin or the theme that loads a list item by item, with a separate query for each. Report it to the developer of the plugin or theme; the PDF report is a good starting point.
curl_execis slow: the page is waiting for a response from an external server. Check the File column to see which plugin is initiating the request; if a timeout occurs, the article on cURL errors 28 and 60 will help.- The request was slowed down by resource limits: if, during a request, the account reached its CPU or disk usage (IO) limit, X-Ray will indicate this specifically for that request. In such cases, it is not the code that is slow, but the system that has throttled the request. Check your account’s resource usage, and if it regularly reaches the limit, it is worth upgrading to a larger plan (see also: 508 Resource Limit Is Reached error).
- Every request is fast, yet the page is slow: the slowness isn’t down to PHP, but to the browser (large images, lots of JavaScript, external fonts and scripts). This is shown by PageSpeed Insights; the article on speeding up WordPress and the article on cPanel hosting performance offer some ideas. Our blog post summarises the common causes of WordPress slowdowns.
Good to know
- X-Ray is part of the CloudLinux operating system. Dedicated cPanel servers do not run CloudLinux by default, so the X-Ray App is not available on them.
- Tracing slows the site down a little while it runs: according to CloudLinux’s measurements, page load times grow by 5–10%. X-Ray is therefore meant for finding the cause of a specific slowdown, not for permanent monitoring. The task stops by itself after the requested number of requests or period, and uses no resources while it is not running.
- Whilst a task is running, the PHP OPcache JIT function is disabled on that particular website; it is re-enabled once the task is complete.
- The logged data (URLs, IP addresses, SQL queries) is available for 30 days, after which it is automatically deleted. If you wish to remove it earlier, please delete the task.
- It is not possible to set up continuous monitoring that sends daily reports via the user interface. If you need to monitor intermittent slowdowns over a longer period, please contact us and we will assist you.
- If you wish to view PHP error messages whilst troubleshooting, enable WordPress’s debug mode.